Brady Campain Scorecard Effectiveness
The Law Center to Prevent Gun Violence and the Brady Campaign to Prevent Gun Violence ranked all fifty states based on thirty policy approaches to regulating guns and ammunition. States received points for stronger laws and lost points for weaker laws.
The purpose of this analysis is to check the validity of the following statement by the Brady Campaign:
the data supports the conclusion that state gun laws and the rate of gun deaths are closely tied
Summary
The data does not support the conclusion that state gun laws and rate of murders with firearm are closely tied (p-value 0.35)
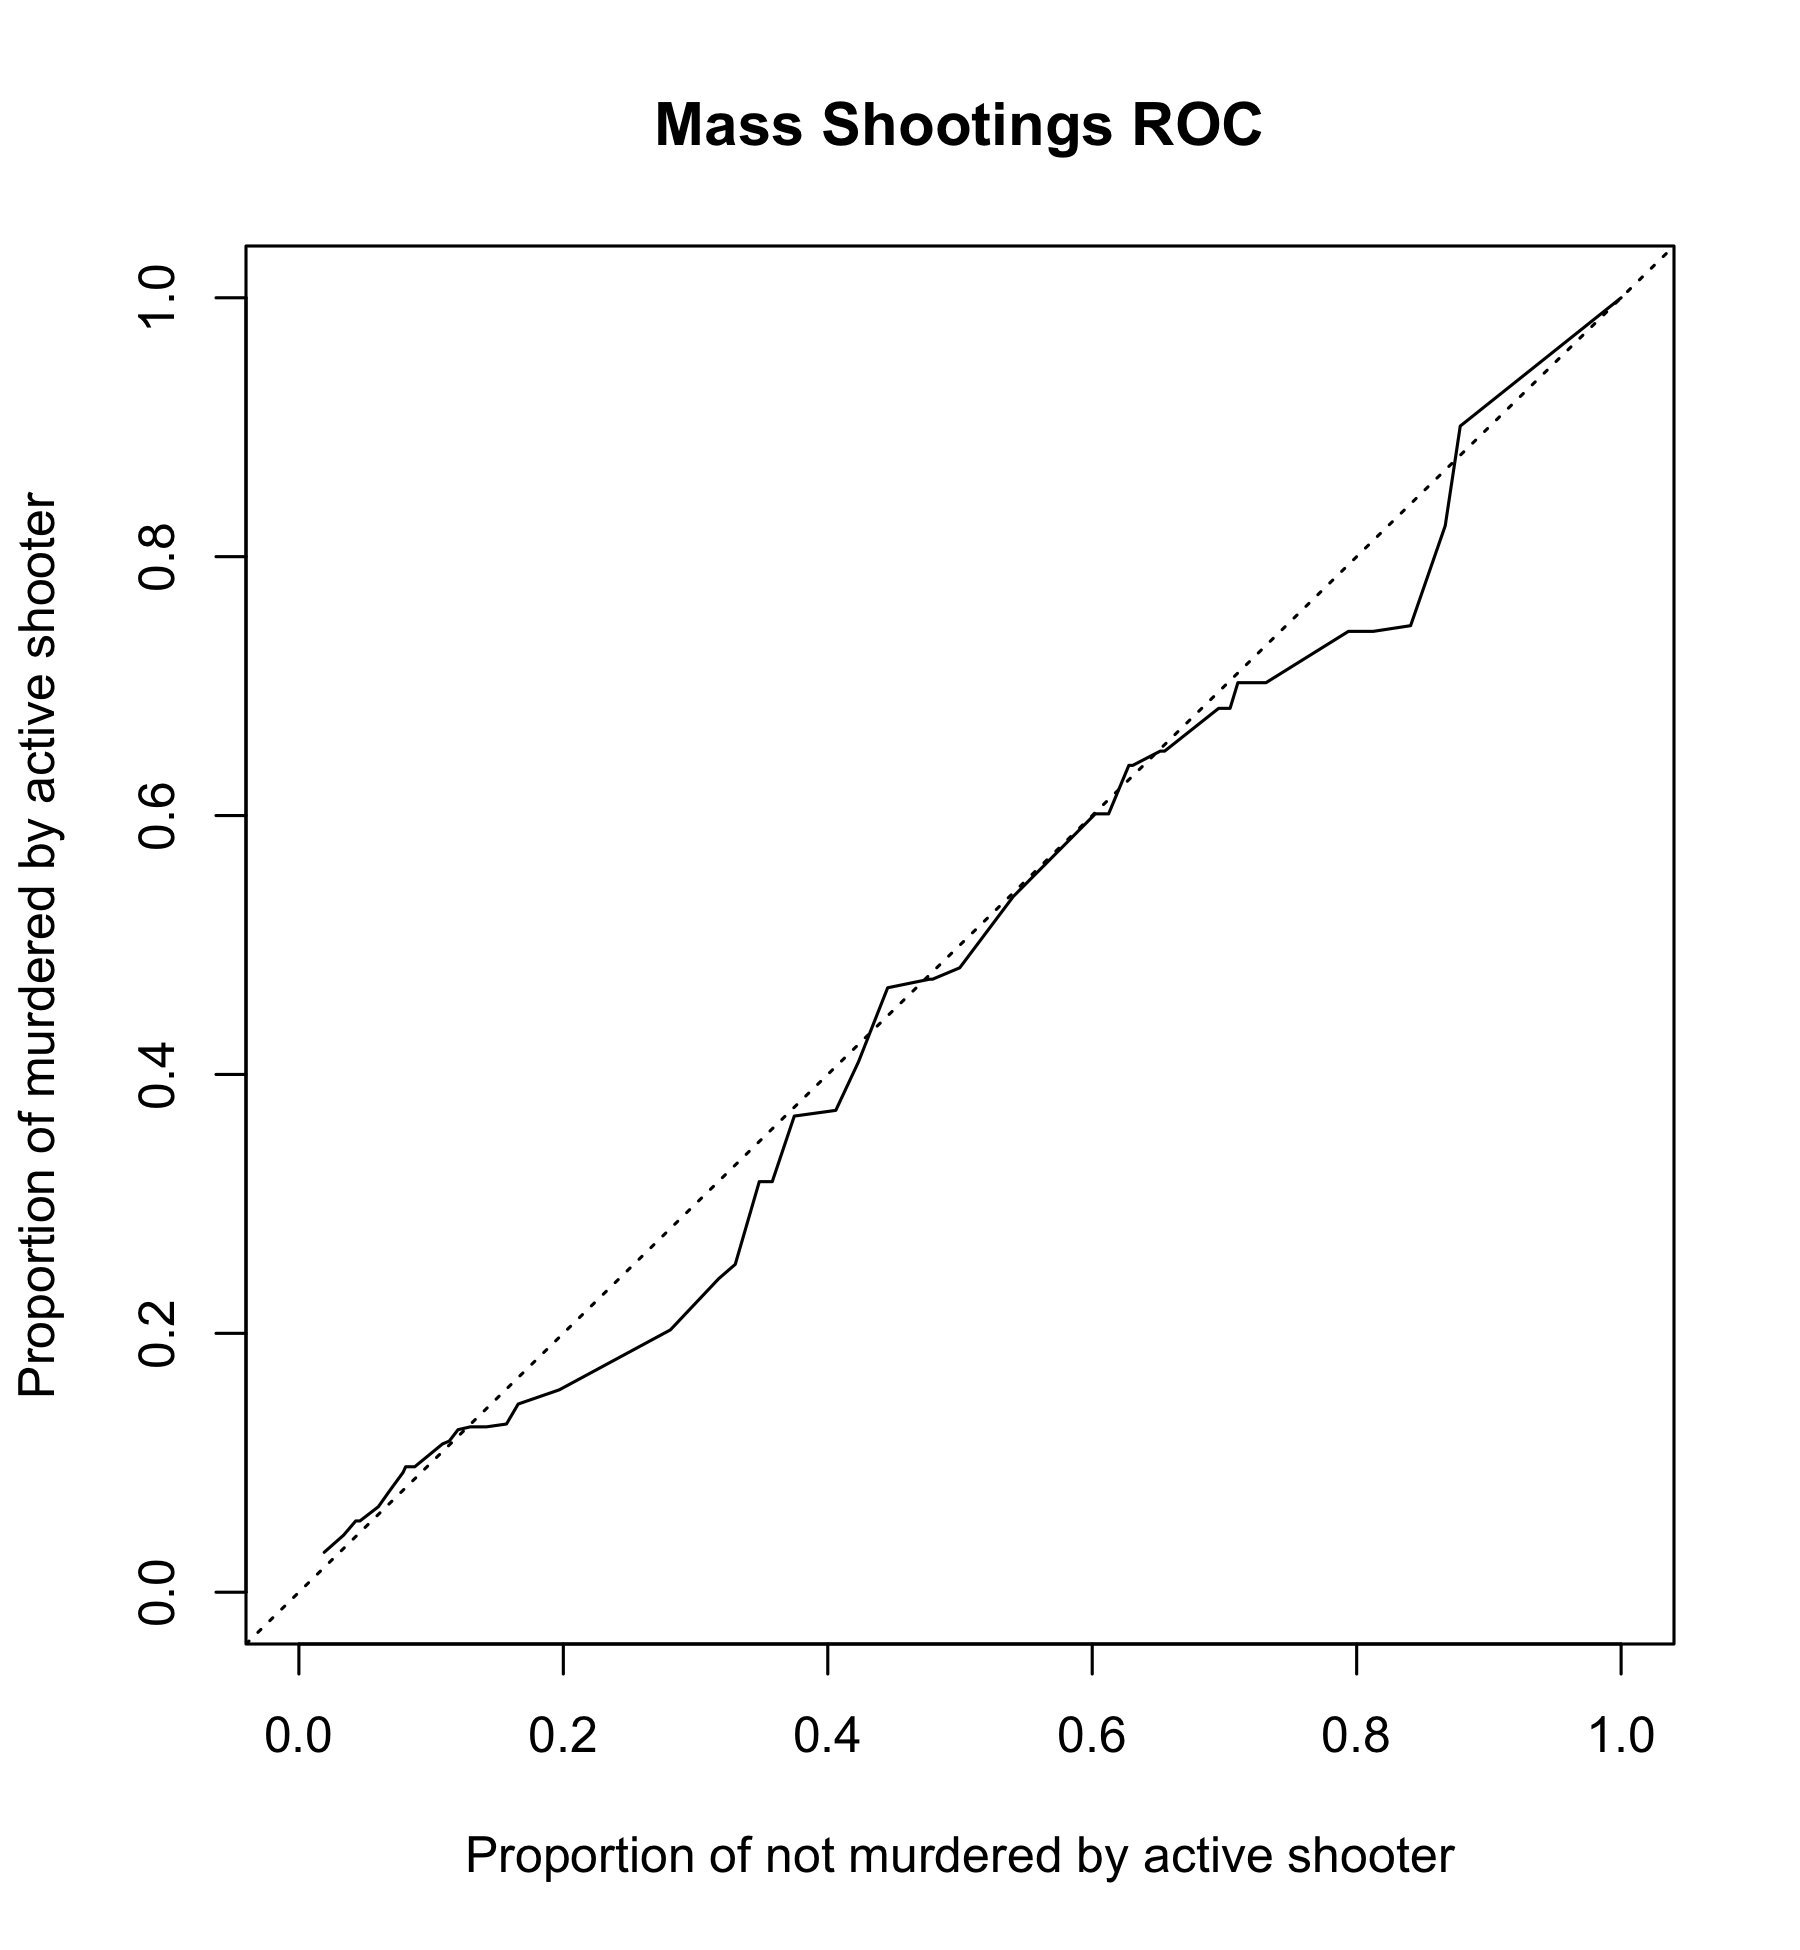
The data does not support the conclusion that state gun laws and rate of deaths in active shooter incidents are closely tied (p-value 0.71)
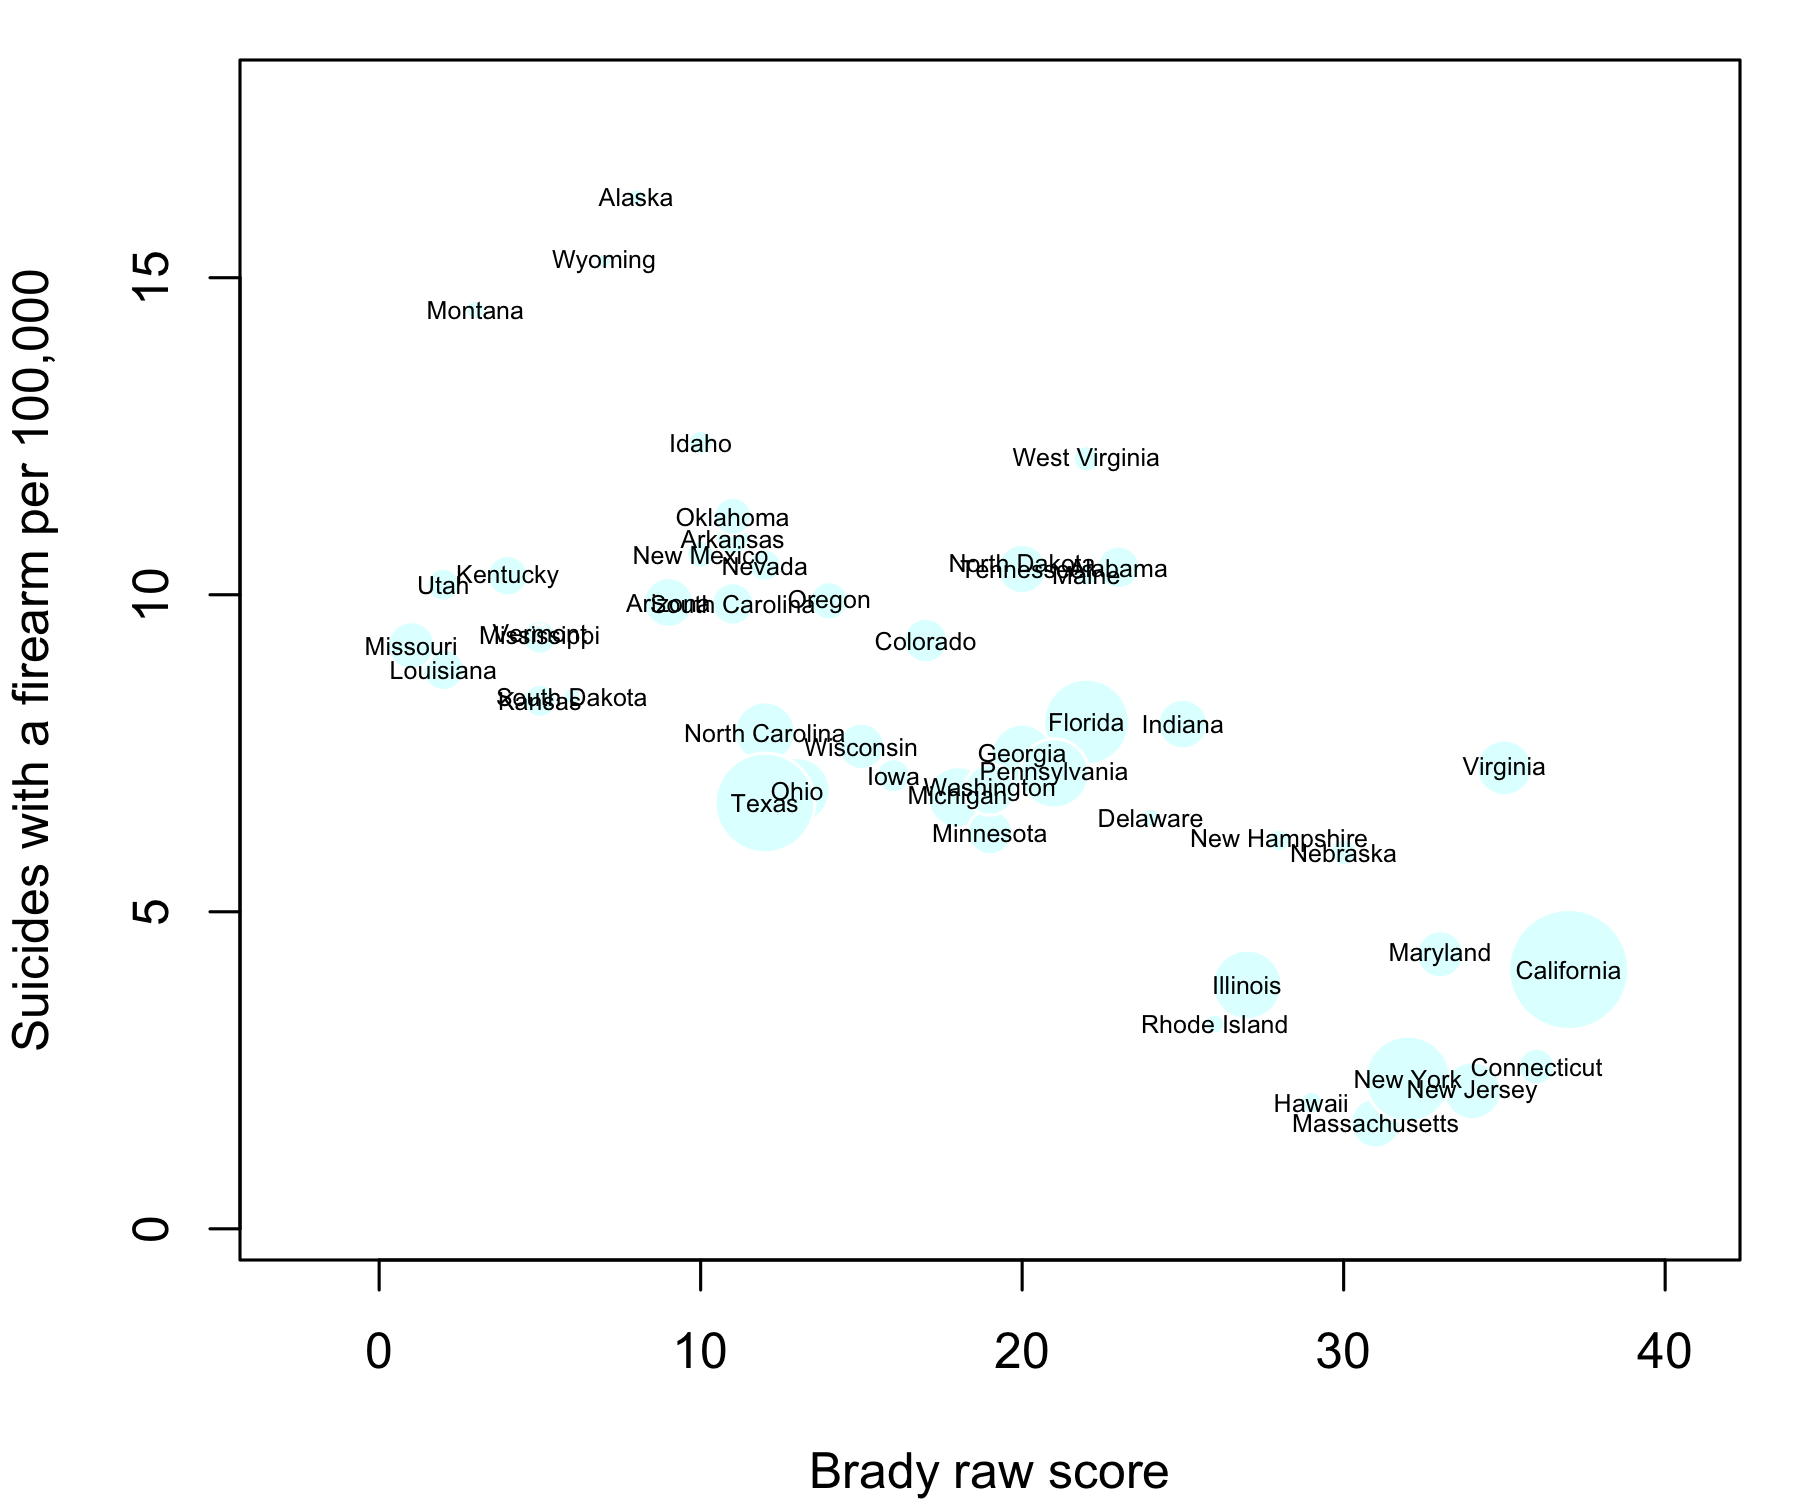
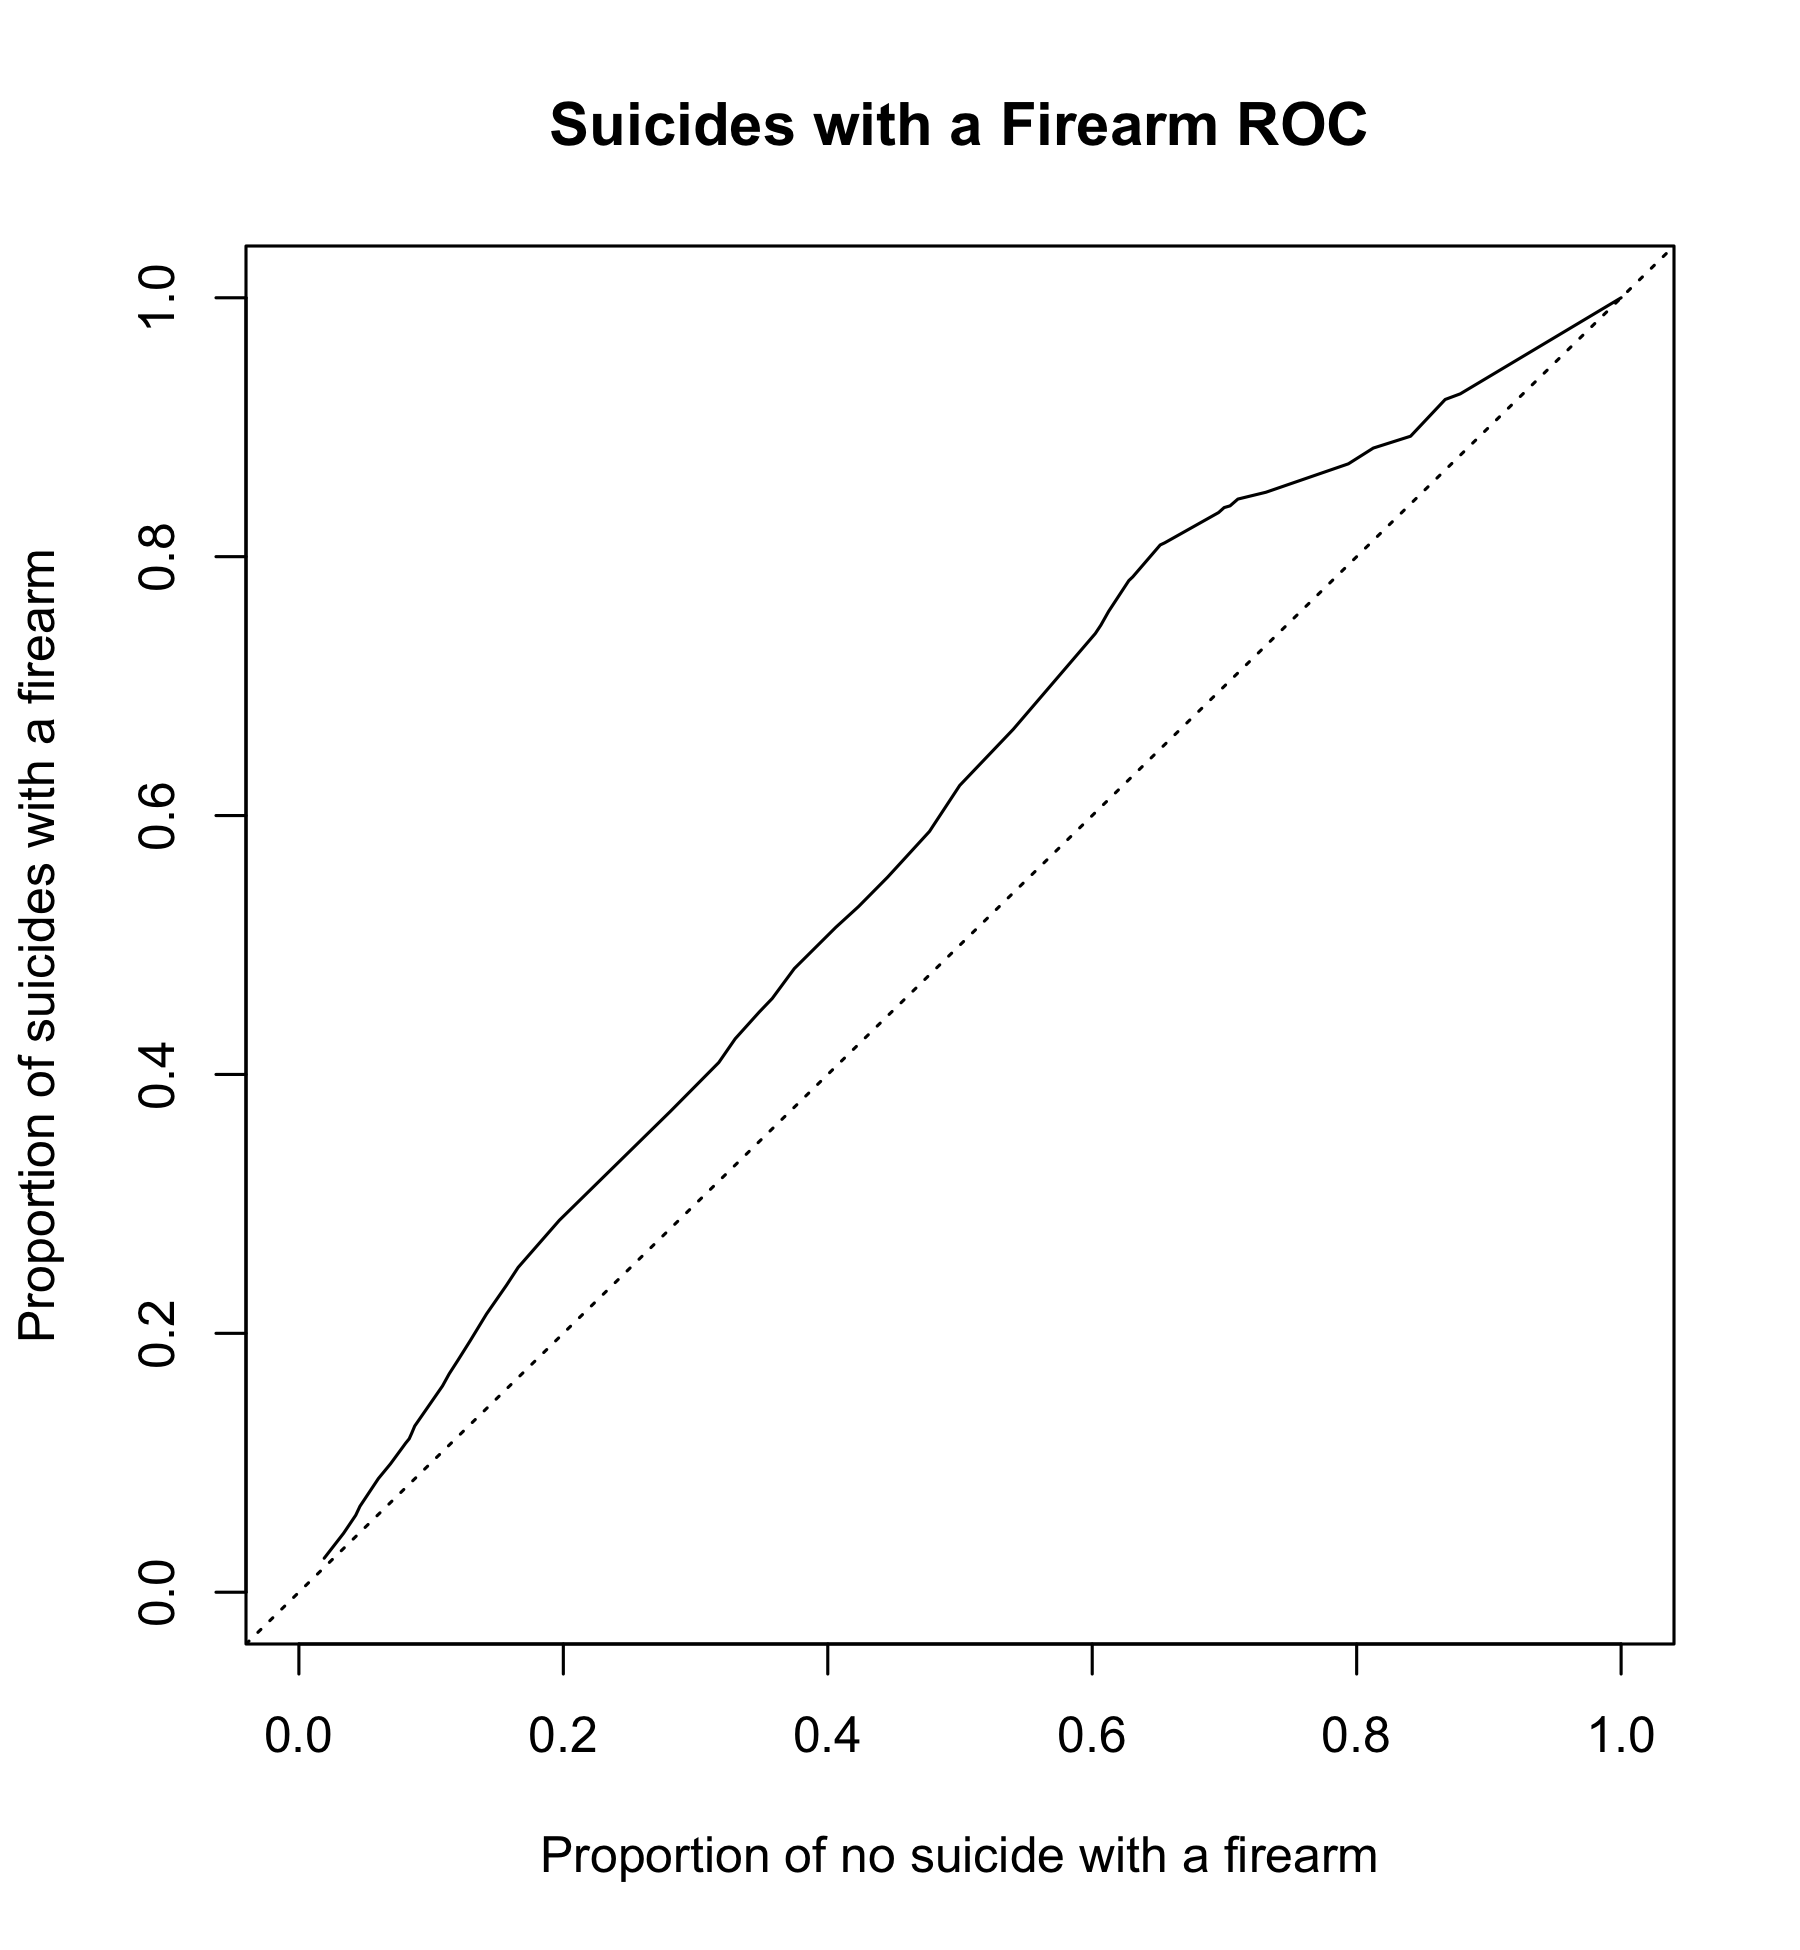
The data supports the conclusion that state gun laws and rate of suicides with a firearm are closely tied (p-value 3.5e-10)
1. Murders with Firearm
Start with a simple scatterplot.
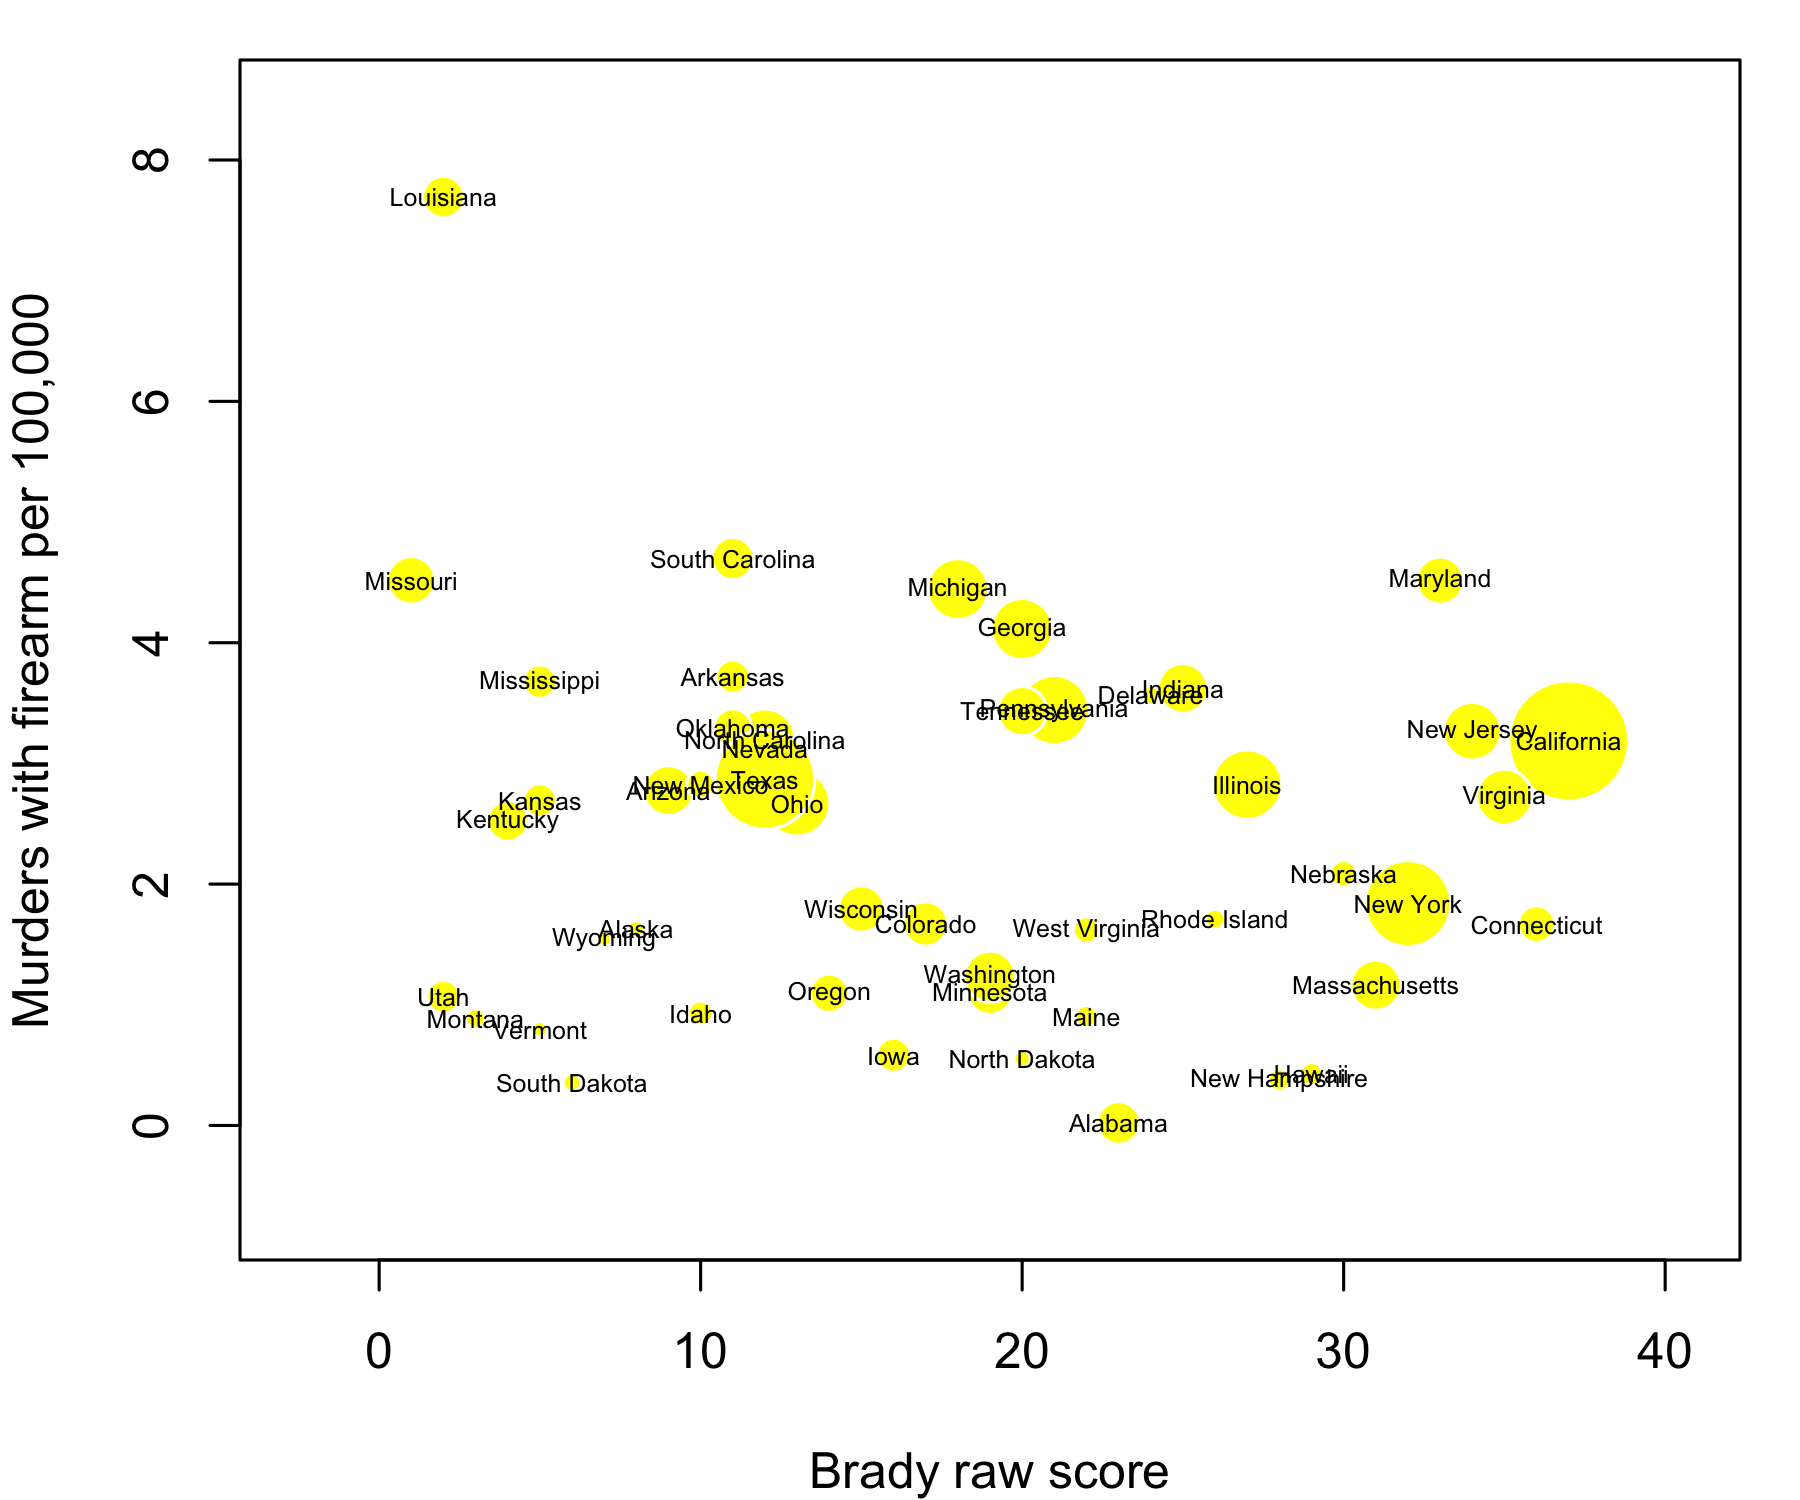
Horizontal axis is raw score (higher number means stronger laws). Vertical axis is rate of murders with firearm. Each state is represented by a cirle, circle size is proportional to state’s population.
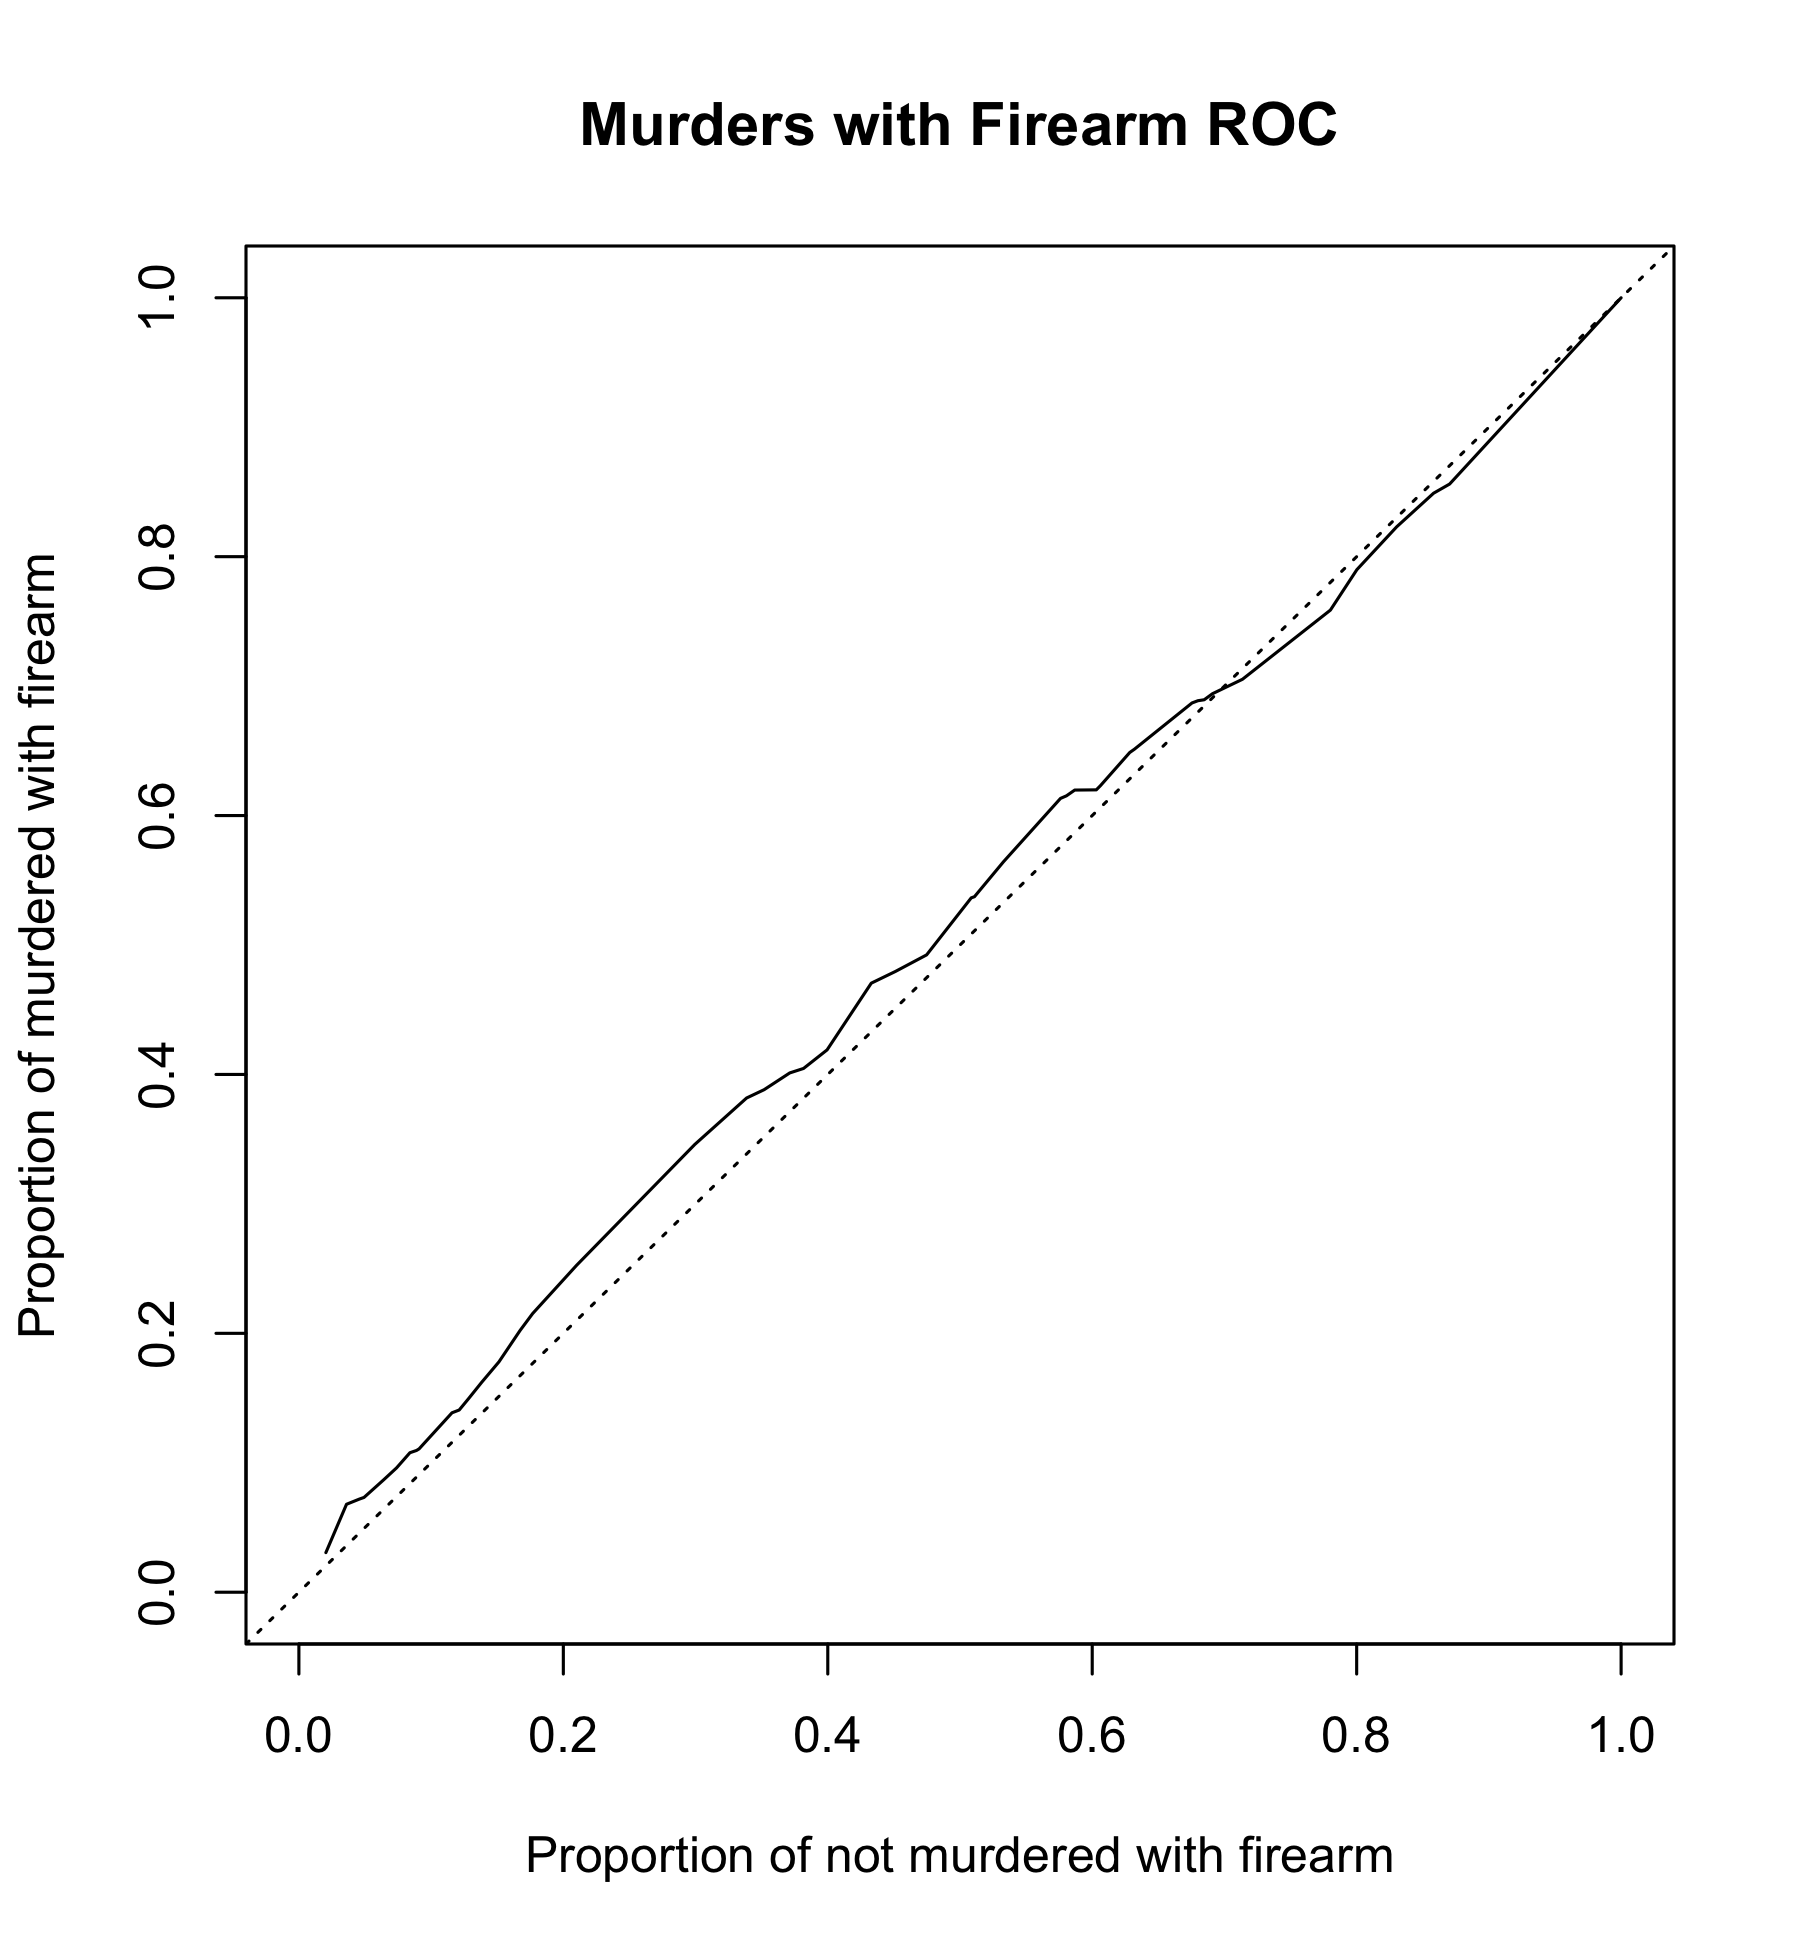
Next, plot receiver operating characteristic. It visually shows separating power of a model. Diagonal line means no separation, curve going through upper left corner means ideal separation.
Fit cross-sectional linear regression weighted by population:
Call:
lm(formula = d$firearm_murders_per_100000 ~ d$raw_score, weights = d$population)
Weighted Residuals:
Min 1Q Median 3Q Max
-6096.5 -2622.8 -948.4 1046.6 9840.0
Coefficients:
Estimate Std. Error t value Pr(>|t|)
(Intercept) 3.14976 0.38951 8.086 1.89e-10 ***
d$raw_score -0.01544 0.01634 -0.945 0.349
---
Signif. codes: 0 '***' 0.001 '**' 0.01 '*' 0.05 '.' 0.1 ' ' 1
Residual standard error: 3039 on 47 degrees of freedom
(1 observation deleted due to missingness)
Multiple R-squared: 0.01866, Adjusted R-squared: -0.00222
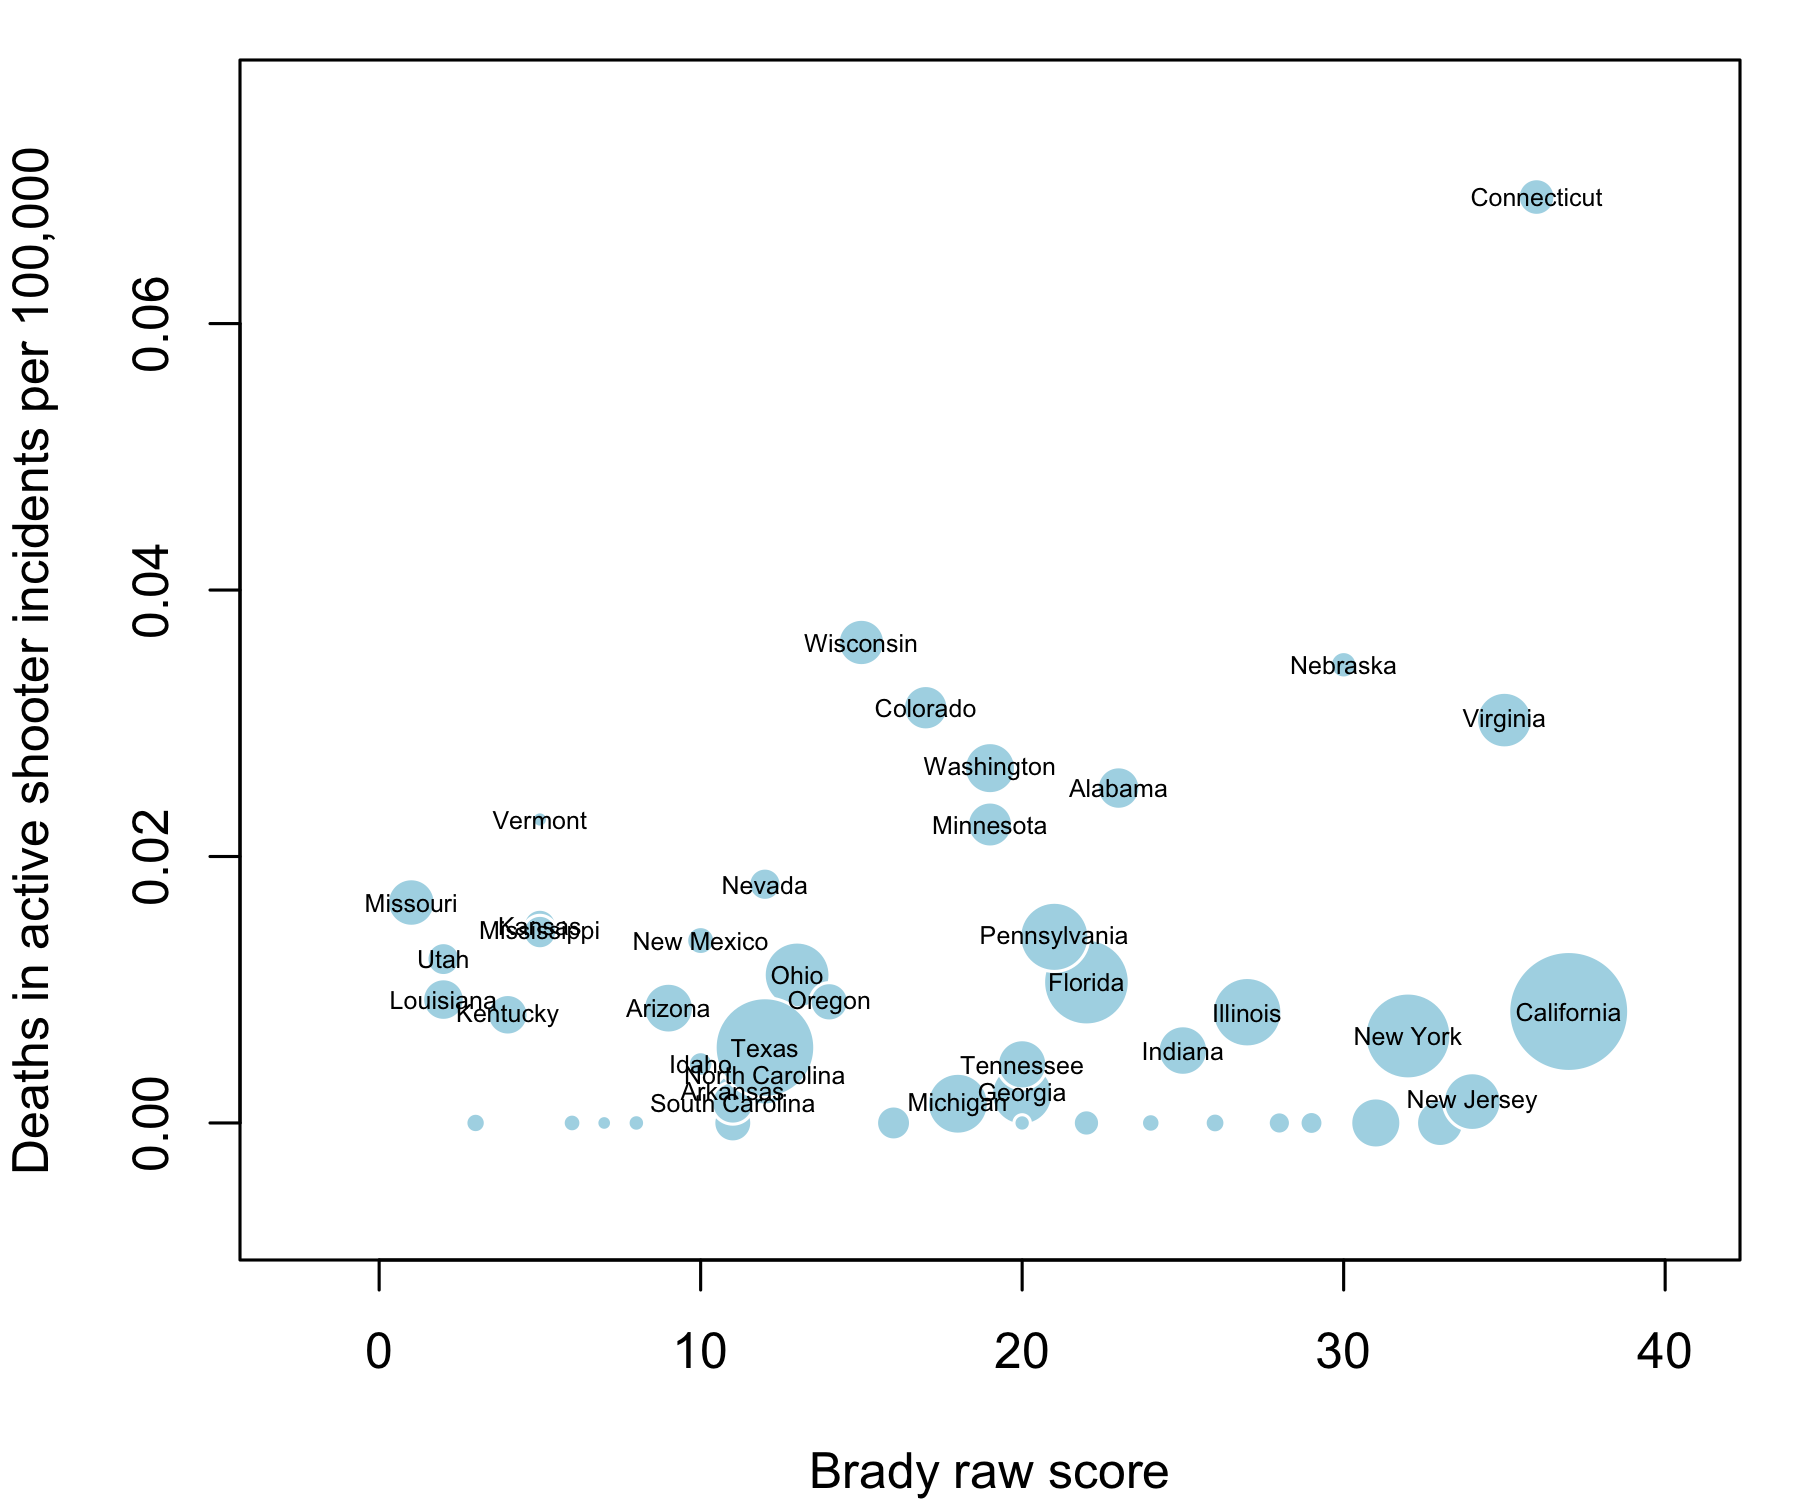
F-statistic: 0.8937 on 1 and 47 DF, p-value: 0.34932. Mass Shootings
Now repeat the same comparison with mass shooting deaths.
Call:
lm(formula = d$active_shooter_deaths_per_100000 ~ d$raw_score,
    weights = d$population)

Weighted Residuals:
    Min      1Q  Median      3Q     Max
-27.990 -14.594  -8.173   9.084 110.794

Coefficients:
             Estimate Std. Error t value Pr(>|t|)
(Intercept) 9.091e-03  3.468e-03   2.622   0.0117 *
d$raw_score 5.532e-05  1.461e-04   0.379   0.7067
---
Signif. codes:  0 '***' 0.001 '**' 0.01 '*' 0.05 '.' 0.1 ' ' 1

Residual standard error: 27.19 on 48 degrees of freedom
Multiple R-squared:  0.002977,  Adjusted R-squared:  -0.01779
F-statistic: 0.1433 on 1 and 48 DF,  p-value: 0.7067
3. Suicides with a Firearm
Finally, repeat the same comparison with suicides with a firearm.
Call:
lm(formula = d$suicides_with_firearms_per_100000 ~ d$raw_score,
    weights = d$population)

Weighted Residuals:
    Min      1Q  Median      3Q     Max
-9989.8 -2144.6   646.1  3918.4  9323.4

Coefficients:
            Estimate Std. Error t value Pr(>|t|)
(Intercept) 10.86456    0.58940  18.433  < 2e-16 ***
d$raw_score -0.19537    0.02484  -7.867 3.51e-10 ***
---
Signif. codes:  0 '***' 0.001 '**' 0.01 '*' 0.05 '.' 0.1 ' ' 1

Residual standard error: 4621 on 48 degrees of freedom
Multiple R-squared:  0.5632,    Adjusted R-squared:  0.5541
F-statistic: 61.88 on 1 and 48 DF,  p-value: 3.505e-10
Sources
Brady Campain to Prevent Gun Violence, 2013 State Scorecard
United States Census Bureau, Population Estimates
FBI, A Study of Active Shooter Incidents in the United States Between 2000 and 2013
Data
            state raw_score murders murders_with_firearms active_shooter_deaths suicides_with_firearms population
1         Alabama        23       2                     1                    17                    504    4830533
2          Alaska         8      34                    12                     0                    120     737442
3         Arizona         9     304                   184                     8                    655    6630799
4        Arkansas        11     154                   110                     1                    322    2957957
5      California        37    1745                  1224                    45                   1571   38414128
6        Colorado        17     174                    88                    23                    489    5271132
7     Connecticut        36      86                    60                    35                     92    3597168
8        Delaware        24      39                    33                     0                     60     925353
9         Florida        22      NA                    NA                    29                   1566   19594467
10        Georgia        20     534                   411                     3                    747    9991562
11         Hawaii        29       9                     6                     0                     28    1408765
12          Idaho        10      26                    15                     1                    200    1612785
13       Illinois        27     433                   364                    15                    496   12889580
14        Indiana        25     311                   238                     5                    523    6570518
15           Iowa        16      42                    18                     0                    221    3092224
16         Kansas         5     112                    78                     6                    241    2894630
17       Kentucky         4     165                   111                     5                    453    4398500
18      Louisiana         2     453                   356                     6                    408    4627491
19          Maine        22      24                    12                     0                    137    1328778
20       Maryland        33     379                   268                     0                    257    5936040
21  Massachusetts        31     135                    78                     0                    112    6708810
22       Michigan        18     625                   440                     2                    674    9900506
23      Minnesota        19     110                    60                    17                    339    5420541
24    Mississippi         5     142                   110                     6                    279    2990976
25       Missouri         1     371                   273                    14                    556    6043708
26        Montana         3      15                     9                     0                    147    1014402
27       Nebraska        30      57                    39                     9                    111    1869300
28         Nevada        12     157                    87                     7                    292    2790366
29  New Hampshire        28      21                     5                     0                     81    1322660
30     New Jersey        34     401                   291                     2                    194    8907384
31     New Mexico        10     106                    59                     4                    222    2086890
32       New York        32     648                   362                    18                    465   19691032
33 North Carolina        12     452                   315                     5                    771    9845432
34   North Dakota        20      11                     4                     0                     76     723626
35           Ohio        13     434                   309                    18                    800   11572232
36       Oklahoma        11     191                   127                     0                    433    3853405
37         Oregon        14      78                    43                     5                    389    3928030
38   Pennsylvania        21     594                   440                    25                    918   12783536
39   Rhode Island        26      31                    18                     0                     34    1052856
40 South Carolina        11     296                   224                     1                    470    4768498
41   South Dakota         6      12                     3                     0                     71     845270
42      Tennessee        20     327                   223                     4                    676    6496130
43          Texas        12    1133                   760                    21                   1780   26500674
44           Utah         2      49                    31                     5                    295    2903685
45        Vermont         5       9                     5                     2                     59     627129
46       Virginia        35     315                   225                    35                    601    8267875
47     Washington        19     155                    86                    26                    483    6973281
48  West Virginia        22      54                    30                     0                    225    1852985
49      Wisconsin        15     157                   103                    29                    437    5743653
50        Wyoming         7      15                     9                     0                     89     583131
Fine print
FBI UCR has no murder data for Florida, limited data for Alabama and Illinois.